How to Use the Treatment Plot Template
Introduction
This document will explain in details how to use the treatment plot template.
You can start working on any treatment plot scope based on our Github example. As soon as you clone it into your local environment, run “npm i” or ”yarn” inside the root directory to install all the dependencies needed.
If you haven't worked on any Corva Dev Center application, you’d need to run “npm i -g @corva/create-app” in order to install the Command Line Tool first.
Once this process is complete, open the code in any source-code editor of your choice. Open the App.js file, here you will need to define the correspondent asset_id. You have two options to do this.
Hardcode value
For quick testing, you can hardcode this value like this:
const asset_id = 12345678
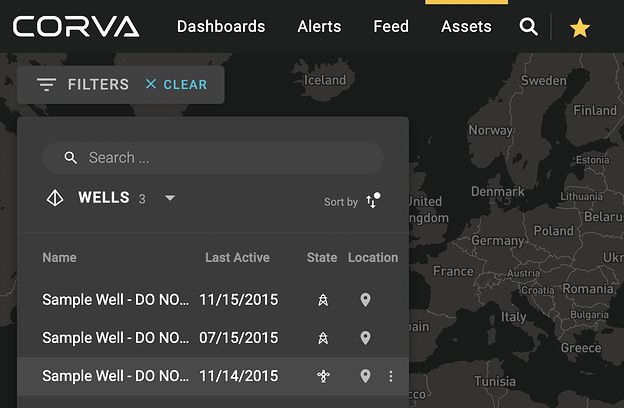
You can find the value of your asset_id in the Assets Section, just click the well you want the asset id from:

Asset_id value
And from the URL, extract the following number:

URL
Asset selector
If you want to take advantage of the Pad mode selector feature that Corva has under the hood within each Completion App, please follow these instructions and implement them into the Treatment Plot template.
Running the app locally
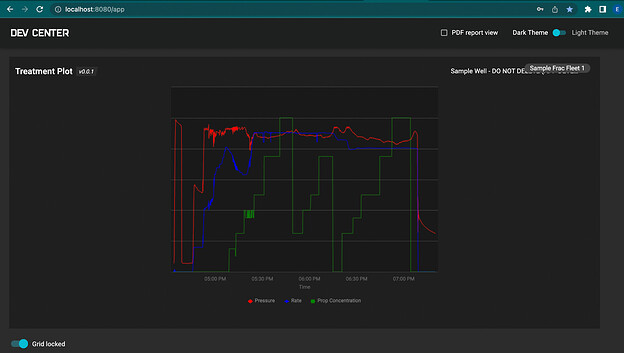
Save any changes you’ve made in the code. Inside the root directory over your terminal, run the command “yarn start” to start the local server. It will automatically open the app view in your preferred browser on localhost using the 8080 port:

Localhost:8080
The only prop that this Treatment Plot component needs is the asset id. Context has been implemented so you can use this value and others across all children and across different charts if needed.
Constants to consider
Inside the directory of the Treatment component, you can find a constants file in which you will need to defined the following important values:
DATASET: the name of the collection, usually called “completion.wits”
PROVIDER: the name of your company in Dev Center
FIELDS: three main attributes needed for a Treatment plot are: Pressure, Rate and Prop Concentration. You should define the key names of these attributes, as well as the units, color and the label that you want to display in the plot axis and the hover tooltip component:
export const FIELDS = {
   pressure: {
       attributeName: 'wellhead_pressure',
       color: 'red',
       label: 'Pressure',
       units: 'PSI'
   },
   rate: {
       attributeName: 'slurry_flow_rate_in',
       color: 'blue',
       label: 'Rate',
       units: 'BPM'
   },
   concentration: {
       attributeName: 'total_proppant_concentration',
       color: 'green',
       label: 'Prop Concentration',
       units: 'PPG'
   },
}
Note that “attributeName” is the name of the key in your collection you want the data from.
Sharing values across multiple components such as Highcharts plots
As mentioned before, createContext has been implemented so you can share props across multiple components inside the app. In this example we provide you with a zoom status:
function App(props) {
 const [isZoomActive, setIsZoomActive] = useState(false)
 return (
     …
     <div className={styles.content}>
       <ChartsContext.Provider value={{ asset_id, isZoomActive, setIsZoomActive }}>
           <TreatmentPlot/>
           <AnotherPlot/>
       </ChartsContext.Provider>
     </div>
     …
 )
}
Zoom status
In this scenario, both TreatmentPlot and AnotherPlot components have access to those values, so if you make use of setIsZoomActive inside TreatmentPlot, the isZoomActive value will change for both components. You will need to import the correspondent Context in each component you want that value to work with:
import { useContext } from 'react'
import { ChartsContext } from '../../App'
export default function AnotherPlotComponent() {
   const { asset_id, isZoomActive } = useContext(ChartsContext)
   return (
       <section>
           …
       </section>
   )
}
Example
The previous snippet is an over simplification of the code needed, but you can find a complete code structure inside the Chart/index.js file.
That is how you can share data and/or statuses between multiple components. In this case we are sharing just a zoom flag that happens each time the user drags and zooms the Treatment Plot, but you can accommodate any specific need using the same principle. Just make sure to set the context values properly and remember that each time a context value changes, all of the children components will rerender, so use useMemo in order to preserve states. You can take a look at the Chart/index.js component to see our implementation on useMemo.